PRODUCT DESIGN · Product Design · 2 weeks · Figma
SaaS Dashboard
Mazain Solution — Senior UI/UX Designer & Design Team Lead, Abdulwahab Khan.
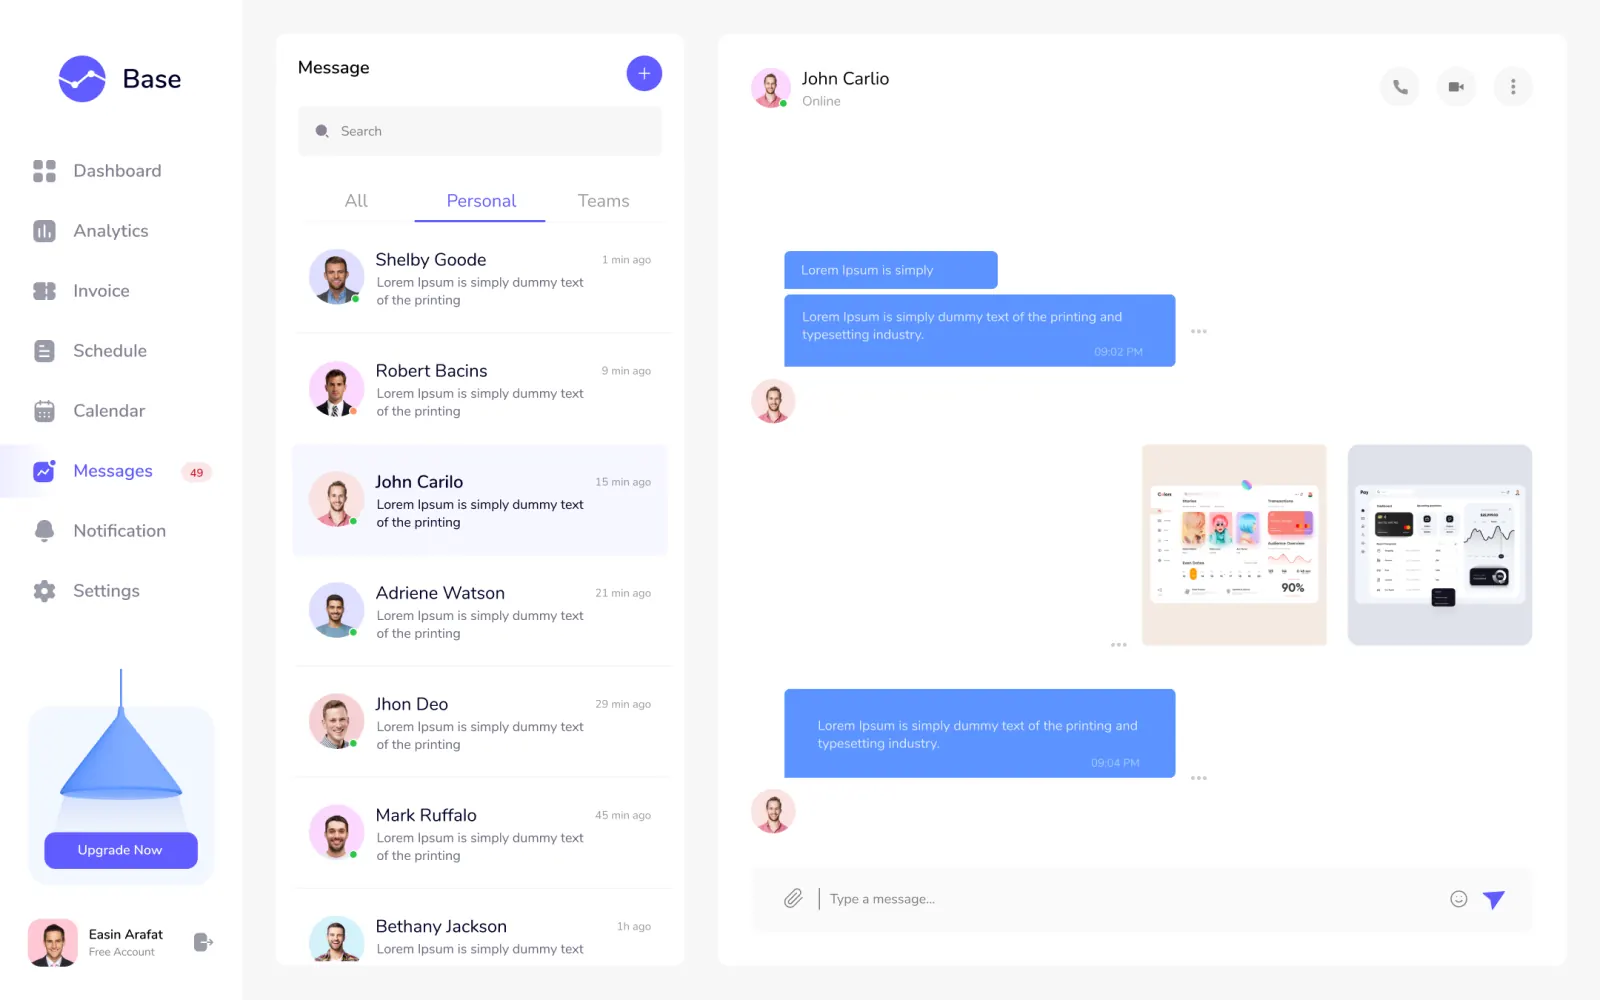
The problem
Store owners opened a dashboard crowded with dozens of data points and closed it without acting, so the busiest screen in the product was also the least useful.
The solution
I reduced the overview to the few metrics owners actually act on and moved everything else into reports, so the first screen answers 'what needs my attention today?'
The research
- Talked to the client's internal users about their daily dashboard tasks
- Reviewed which metrics were used in decisions and which were only displayed
- Mapped navigation paths for the five most common tasks
- Users scanned the page and still could not find the figure they came for
- Most widgets were never clicked, they only added visual noise
- Orders and fulfilment needed attention more often than historical analytics
Key insight: A dashboard should rank information by the action it triggers, not by how much data exists.
My process
Stakeholder Interviews
Talked to the client's internal users to map which dashboard tasks caused the most friction.
Information Architecture
Restructured navigation and data hierarchy around the tasks users actually do daily.
UI & Prototyping
Designed and prototyped high-fidelity screens in Figma, tested with a small internal group.
Prototype & Review
Designed high-fidelity screens in Figma and tested a clickable prototype with a small internal group, adjusting widget hierarchy from what they reached for first.
Design-to-Code Handoff
Delivered a documented design system with chart styles, table patterns and responsive rules so the dev team could ship consistently across the dashboard.
Key design decisions
- A short list of headline metrics — Fewer numbers get read; more numbers get ignored.
- Reports as a separate space — Deep analysis stays one click away without crowding the daily view.
- Orders in context on the overview — Recent orders sit next to the metrics they affect, so action follows insight.
The screens
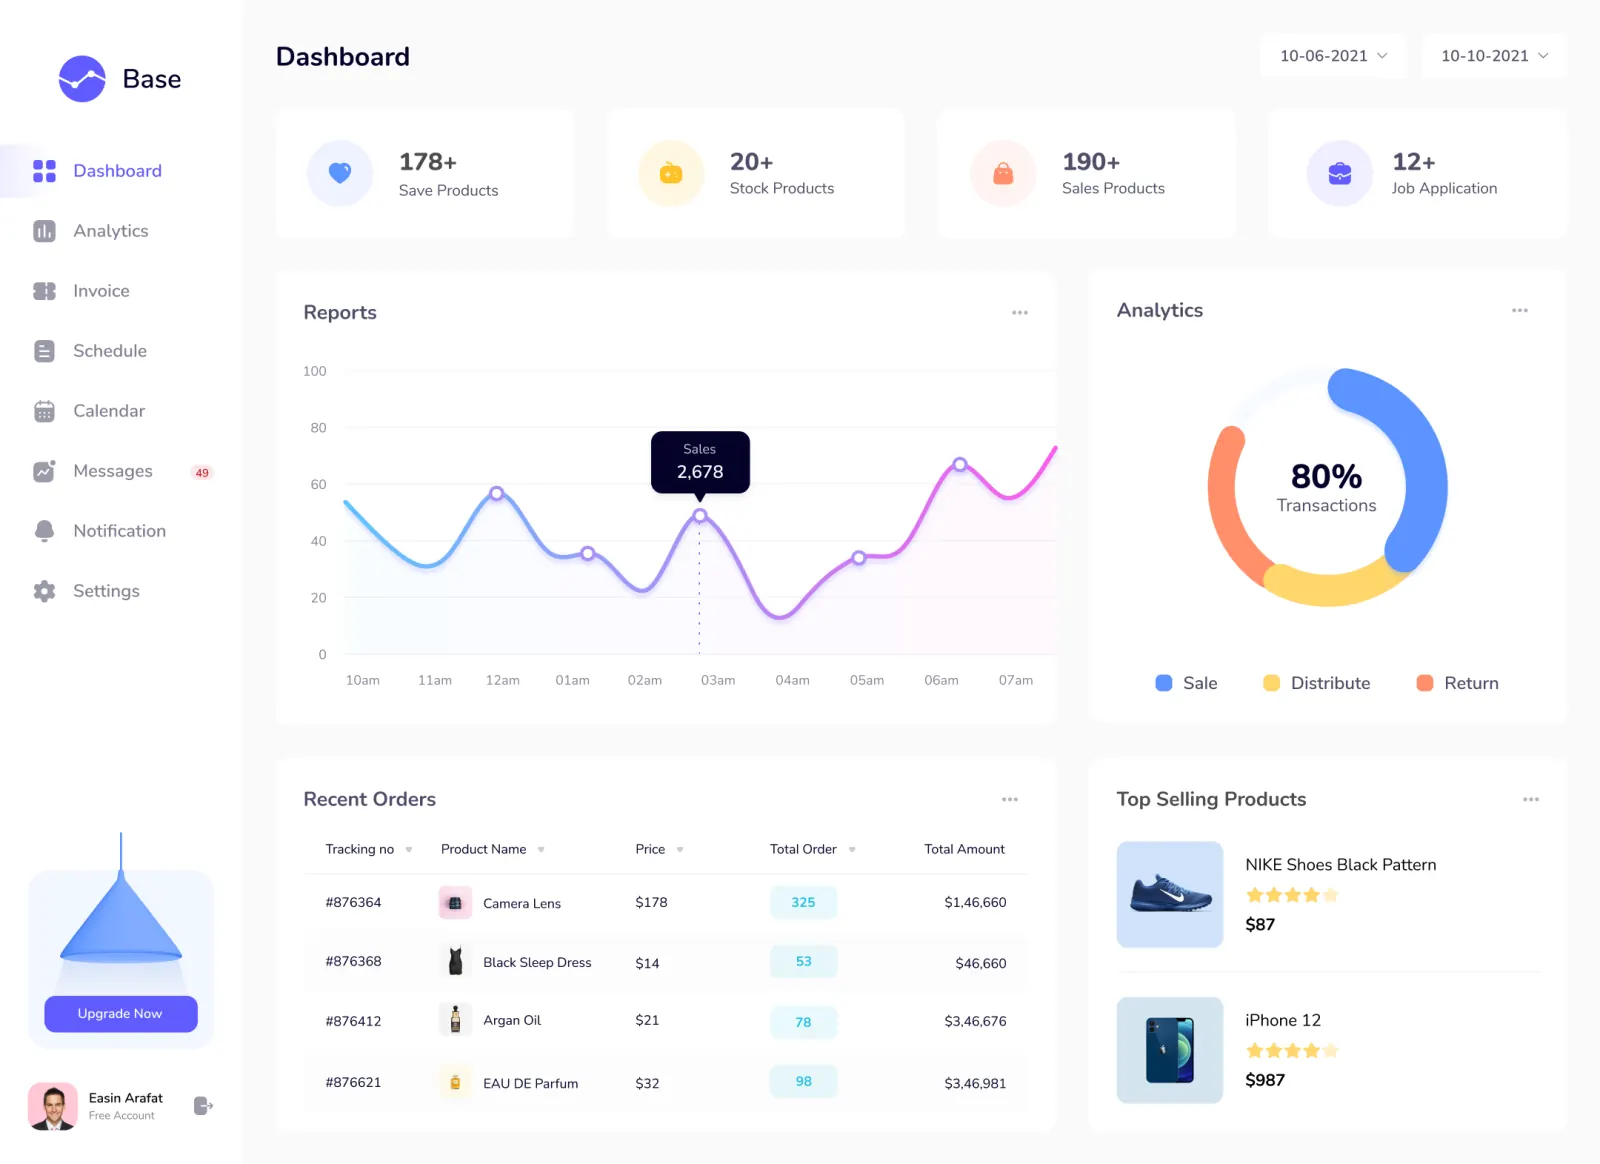 DASHBOARD OVERVIEW
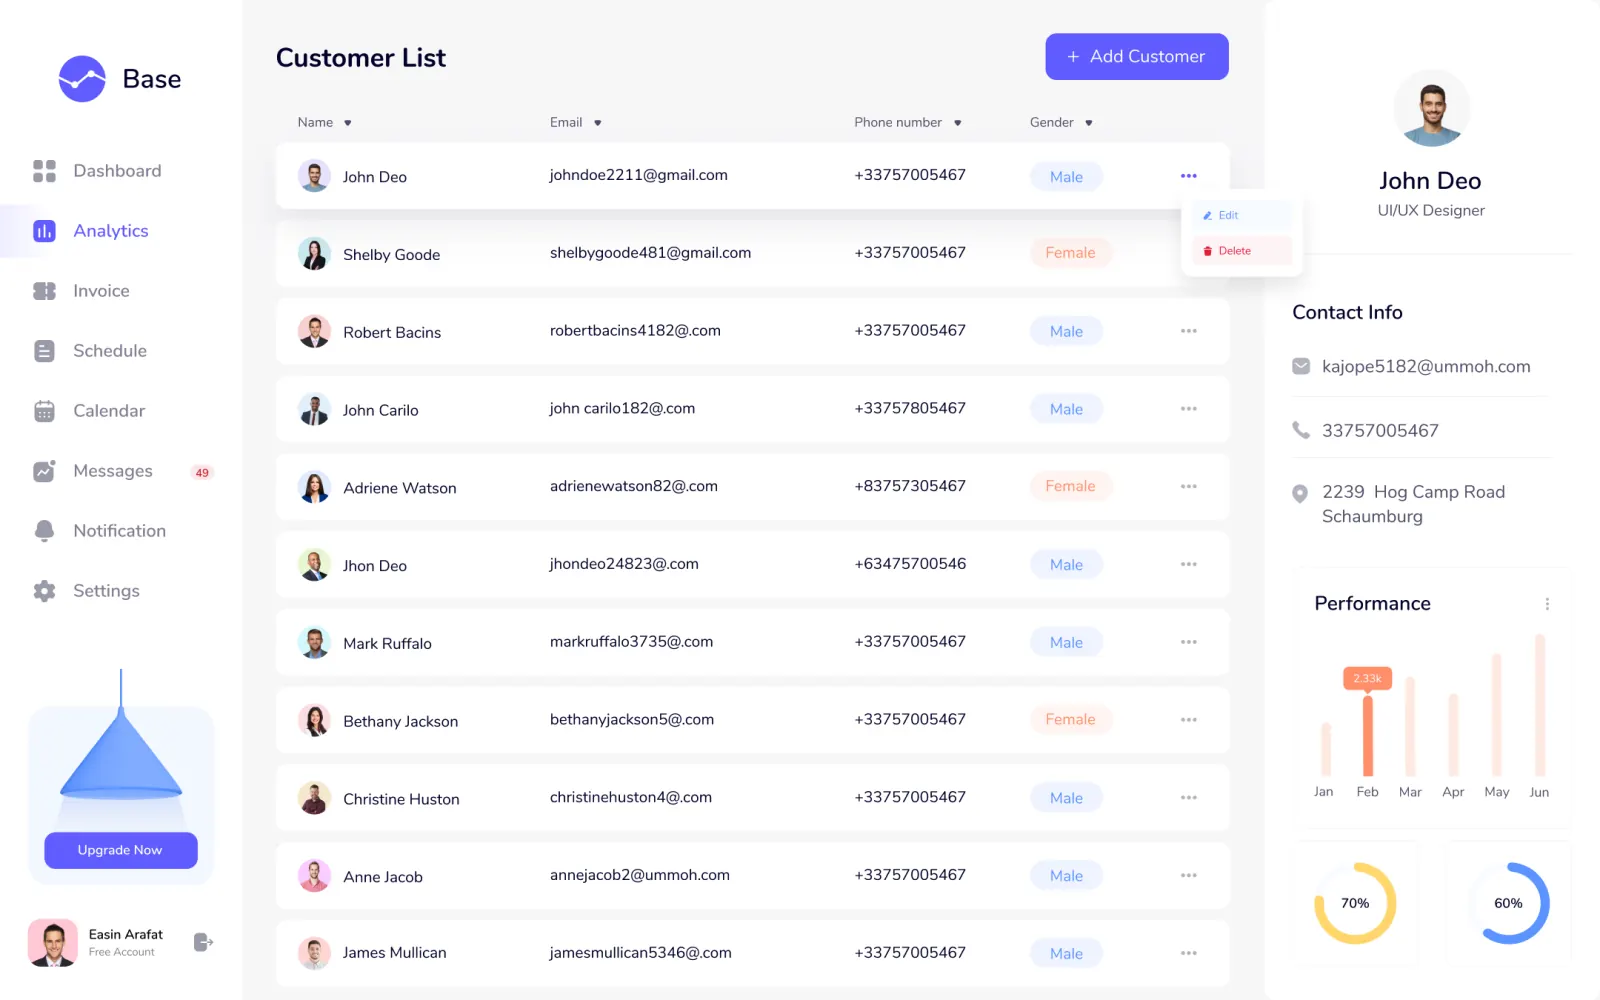 REPORTS & ANALYTICS
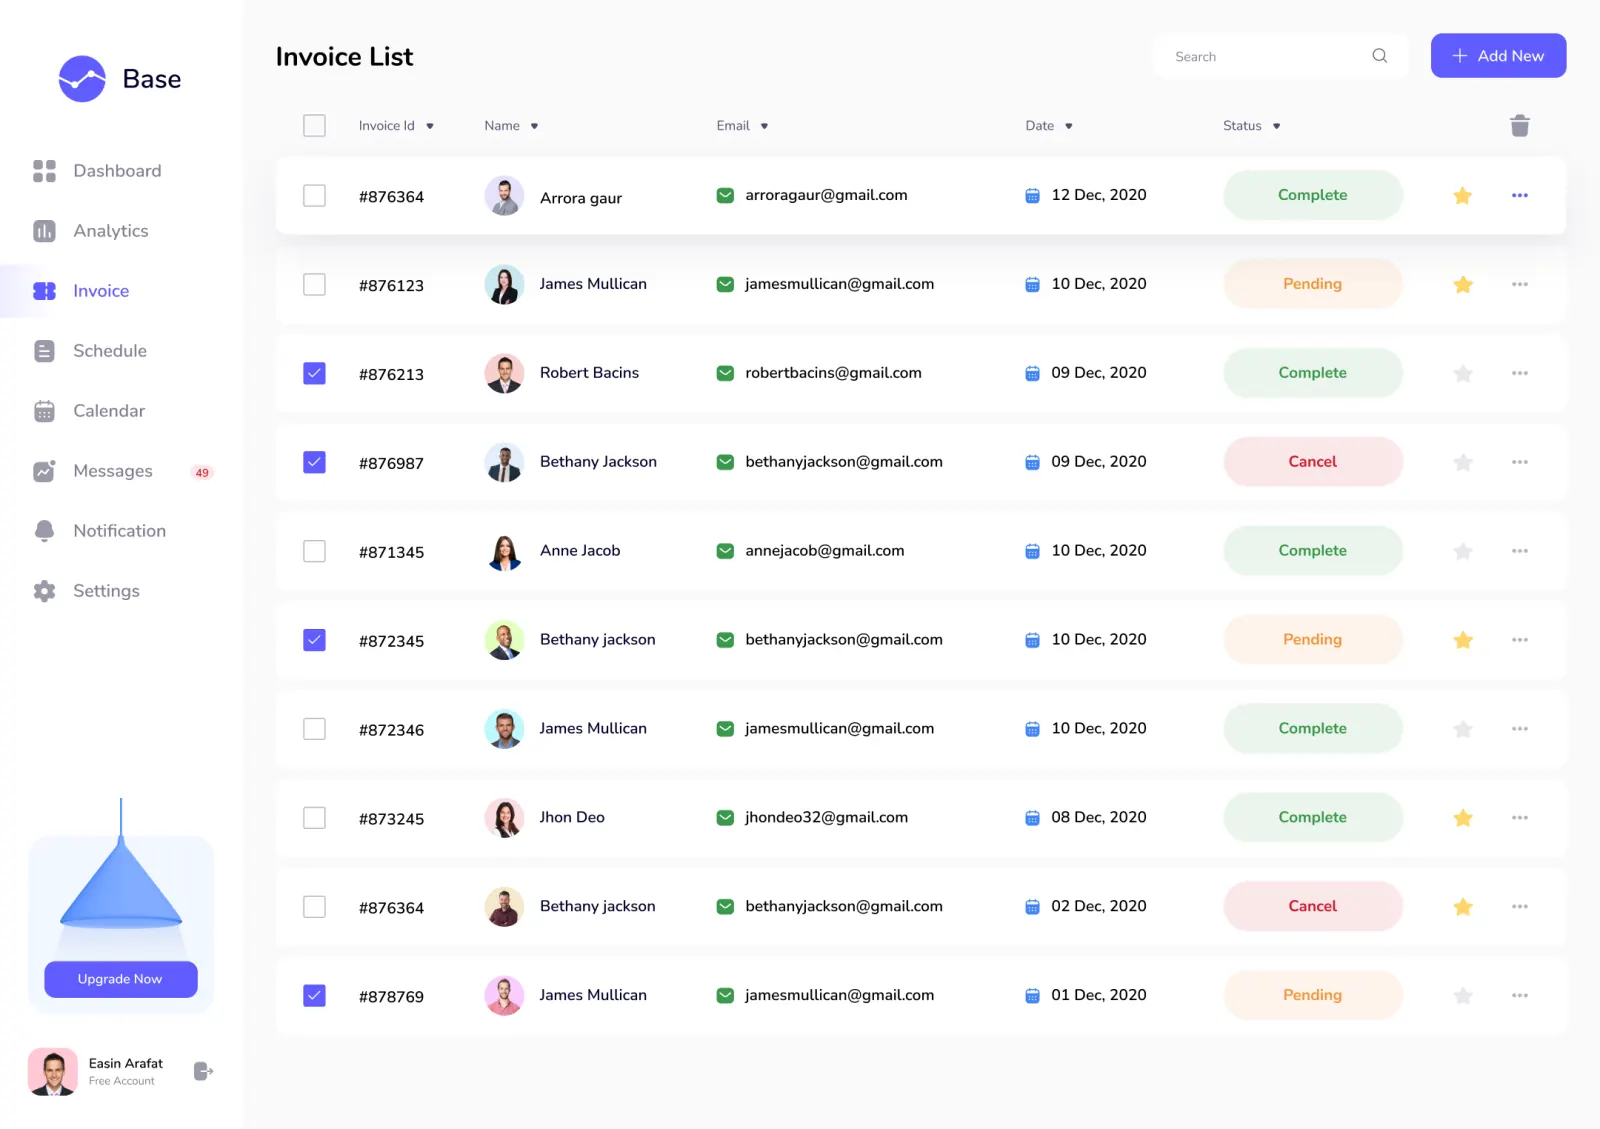 RECENT ORDERS
Results
- 50%+ — Improvement in Task Completion